How to Find Bounce Rate in Google Analytics 4
John / 08 Sep 2023
In Google Analytics 4 (GA4), viewing the bounce rate on various reports is not as straightforward as it used to be in Universal Analytics (UA). This leaves some people quite confused when they want to view this metric.
In this article, I will guide you through the process of finding the bounce rate in Google Analytics 4.
How to View the Bounce Rate
Follow the steps below to view the overall bounce rate for the property.
Step 1: Sign in to your Google Analytics account.
Step 2: Select the property (website or app) whose bounce rate you want to view.
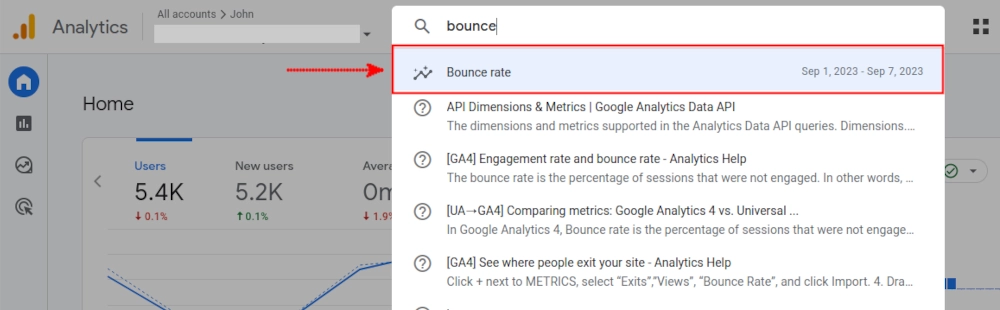
Step 3: Type "bounce rate" in the search box at the top of the page. A menu with some options will appear, click on the "Bounce rate" option.
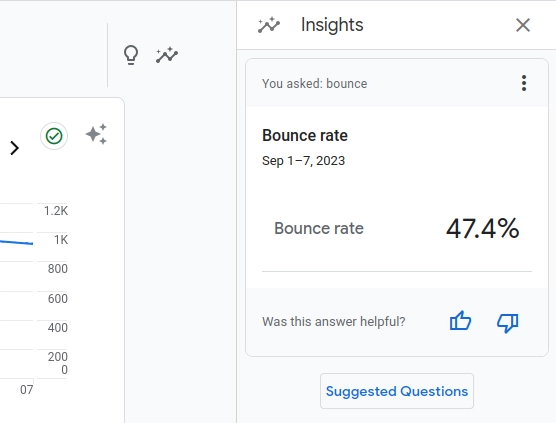
You will see the average bounce rate for the selected timeframe on the right-hand side of the page.
How to Add Bounce Rate Metrics to Your Reports
In Google Analytics 4, reports do not include the bounce rate metric by default. To view the bounce rate in your various reports, you will need to add it by customizing those reports.
Below is the step-by-step process of adding bounce rate metrics to reports:
Step 1: Sign In to Google Analytics
Start by signing in to your Google Analytics account.
Step 2: Select the property
Select the property in which you want to add the bounce rate metric in its reports. You should have the necessary permissions as an Editor or Administrator for this property to customize its reports.
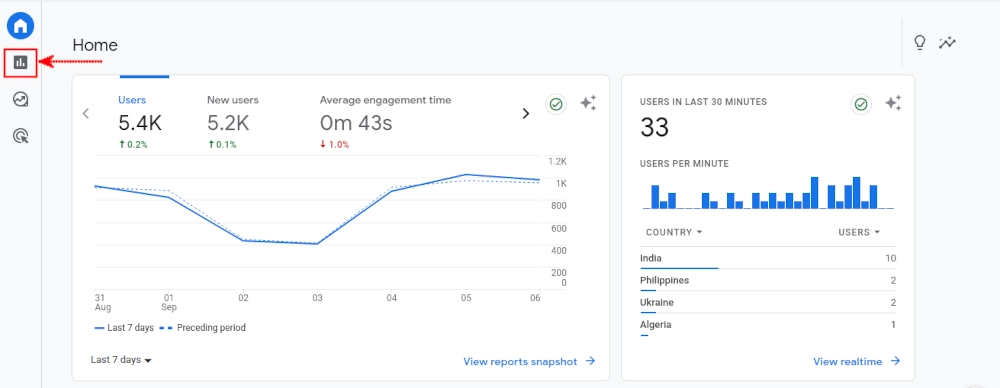
Step 3: Access Reports
Click on the "Reports" option in the left menu.
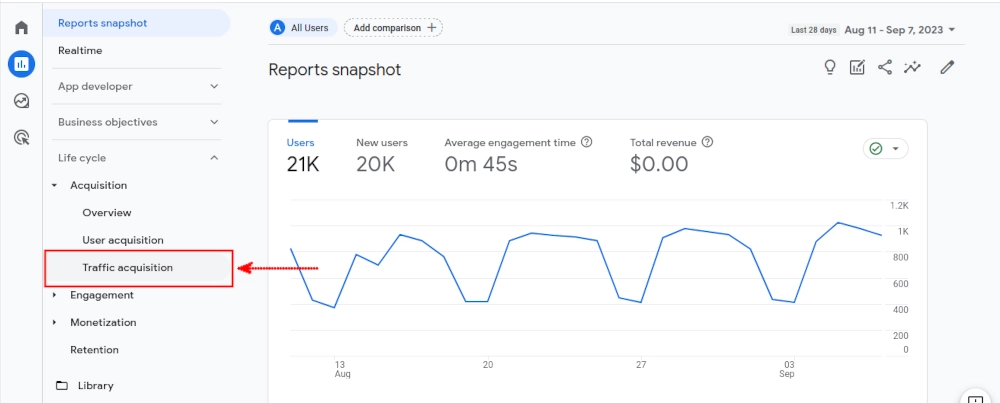
Step 4: Choose the Report to Customize
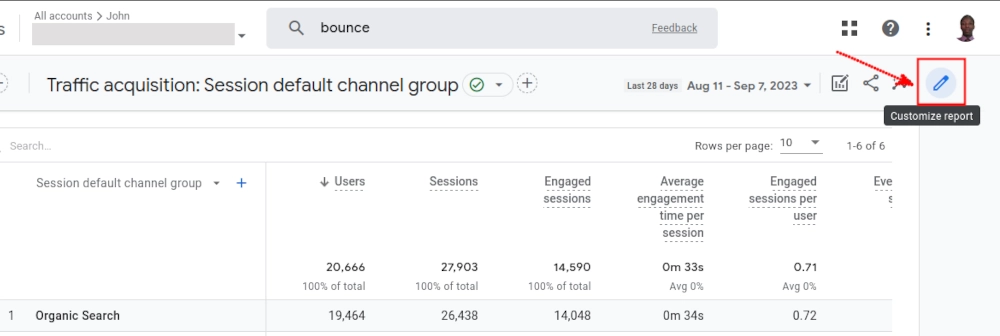
Navigate to the specific report in which you want to add the bounce metric. You can only add metrics to a detailed report and not an overview one. I will use the "Traffic acquisition" report in this example.
Step 5: Customize the Report
In the upper-right corner of the report, you'll find the "Customize report" button. Click on it. Note that you won't see this button if you don't have Editor or Administrator privileges.
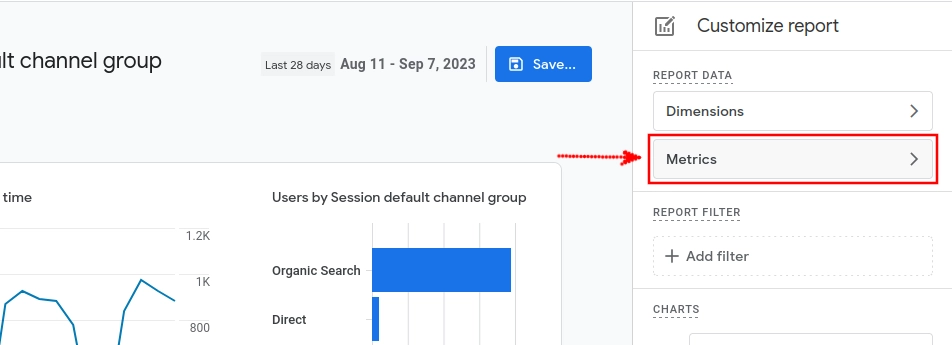
Step 6: Add Metrics
In the "Customize Report" menu, locate and click on "Metrics" under "Report data."
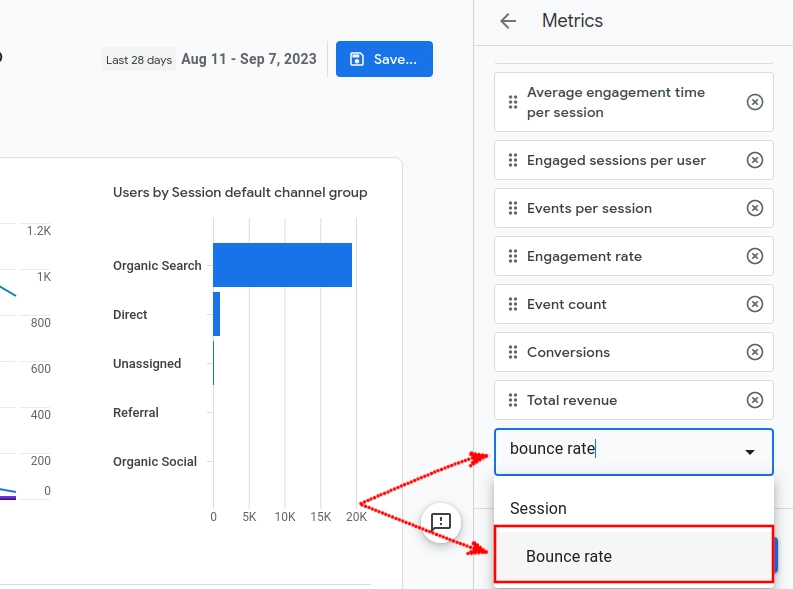
Step 7: Add Bounce Rate Metric
Scroll down to the bottom of the right menu and type "bounce rate" in the search bar. A bounce rate option will appear. Click on it to add it to the menu. If the metric doesn't appear, it's likely already included in the report.
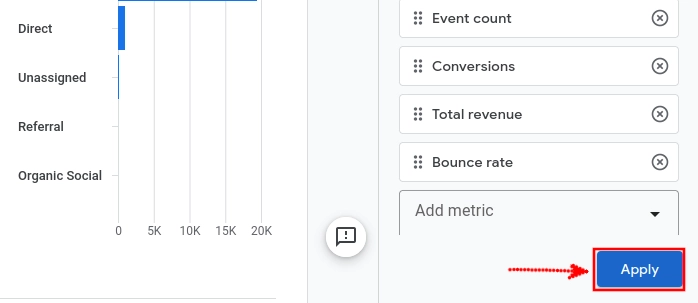
Step 8: Apply Changes
Click on the "Apply" button at the bottom right corner.
Step 9: Save the Changes
Click on the "Save" button at the top of the page and then on the "Save changes to current report" option.
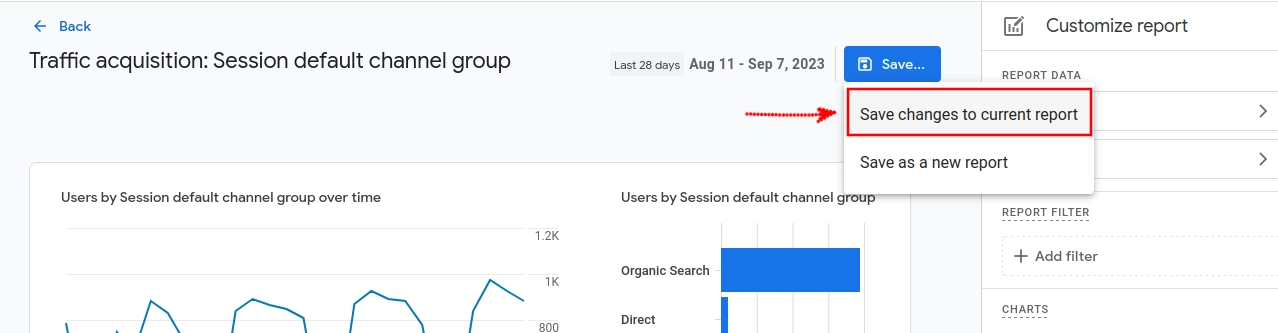
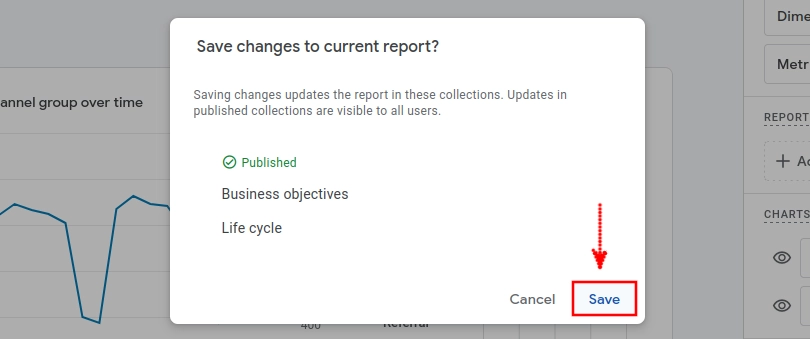
Click "Save" when prompted to confirm if to save changes to the current report.
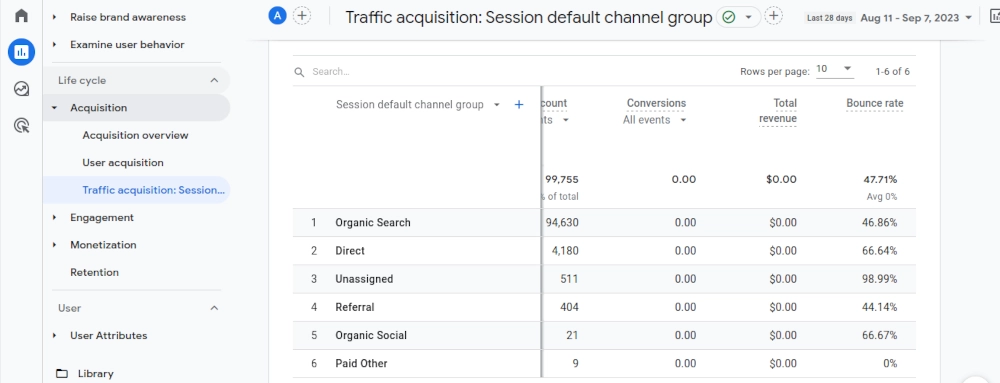
The bounce rate metric will now be visible as one of the columns in the report table. In most cases, you will need to scroll the table to the right to view the bounce rate metric.
Understanding the bounce rate is crucial for optimizing your website or app. A high bounce rate may indicate that visitors aren't finding what they expected or that your content isn't engaging enough. On the other hand, a low bounce rate suggests that users are exploring your site more extensively.
By following the steps outlined in this article, you can add and view bounce rate metrics, gain valuable insights into how users engage with your site, and take steps to improve their experience and drive conversions.